Search
logo

QuickBooks reports and graphs: My Preferences

reports and graphs

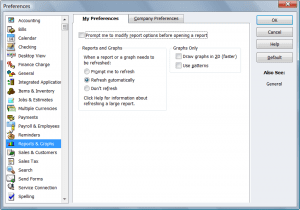
Reports and graphs are a key part of making data significant in QuickBooks.  This section will cover the options that are available in the My Preferences tab for reporting purposes.

  • Prompt Me to Modify Report Options before Opening a Report
    • This option will automatically open the Modify Report window when you create a report.
  • Reports and Graphs
    • This section has options regarding refreshing reports and graphs. You can either choose to be prompted to refresh or refresh automatically, or you can choose not to refresh at all. If you use large reports that take a long time to refresh, you may want to choose not to use the automatic refresh feature as it may slow down productivity.
  • Draw Graphs in 2D
    • This is a great tool for slower computers. This option will force QuickBooks to draw all graphs only in 2D which will help speed up processing time
  • Use Patterns
    • To further speed up performance when rendering a graph, choose Use Patterns to display reports in black and white instead of with colored elements.

Gita Faust

About the Author

Gita Faust has over 30 years of accounting experience in the real estate and property management industry, Gita Faust is more than just a real estate investor; she is also popular for her work as an accountant, consultant, mentor, speaker, QuickBooks Top ProAdvisor, QuickBooks Solution Provider, member of Intuit’s Trainer/Writer Network, and, of course, author. Gita is well-known for her exemplary leadership and advisory skills. In fact, she even helped pioneer the adaptation of QuickBooks to suit the needs of professionals in real estate and property management. To share her knowledge she has written a series of courses titled Simplified Accounting Solution, which provides step-by-step guidance for those working with QuickBooks.

Leave A Comment

Leave a Reply

Your email address will not be published. Required fields are marked *