As we have been discussing, understanding QuickBooks reports is extremely important to understand where your company is financially. The Balance Sheet is a basic financial statement that every business owner should understand and interpret.
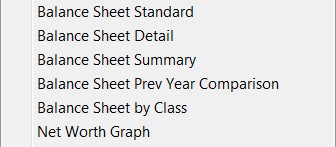
The above reports are available with QuickBooks. What is a Balance Sheet anyways? A Balance Sheet shows the value of your company’s assets, liabilities, and equity as of a particular moment in time. It is called a Balance Sheet because the value of the assets is always equal to the combined value of liabilities and equity.
Those of you who have taken accounting courses probably remember this equation:
Assets = Liabilities + Equity
A Balance Sheet Standard report is a basic Balance Sheet showing your assets, liabilities, and equity for a specific date. The ending balance for each account is listed. Your company’s net income for the current fiscal year is also included in the equity.
A Balance Sheet Detail report expands on the information provided in the standard report. The report shows the starting balance of each account at the beginning of the month, all transactions entered since then, and the ending balance as of the specified date.
A Balance Sheet Summary report is less detailed than the standard report. It shows the ending balance for each type of account. For example, it will show the ending balance of all the bank accounts combined.
The following accounts appear on a Balance Sheet report in QuickBooks: Bank, Accounts receivable, Accounts payable, Fixed asset, Other asset, Other current asset, Other current liability, Long term liability, Credit card, and Equity
The Balance Sheet Previous Year Comparison report compares the value of your business as of a specific date this year to the value of your business as of the same date last year. The change and % columns show the difference between today and one year ago. This is a great tool to analyze how your business is doing compared to last year.
The Balance Sheet by Class report shows your business’s worth at a specific time and also separates it by Class (business segments). For this report to be accurate, you MUST enter a Class for each and every transaction. If you are using QuickBooks for property management, the Balance Sheet by Class report would show the value of your business from each property owner and property. You can analyze which properties are valuable to your business.
The Net Worth Graph shows changes in your company’s net worth. The green bars above the zero line represent the assets for each month. The red bars below the zero line represent the liabilities for each month. The yellow points represent the equity, or net worth, of the business for the month.
If the net worth is in the green, then the assets are greater than the liabilities, which is good. If the net worth is in the red, then the liabilities are greater than the assets, which is not so good.
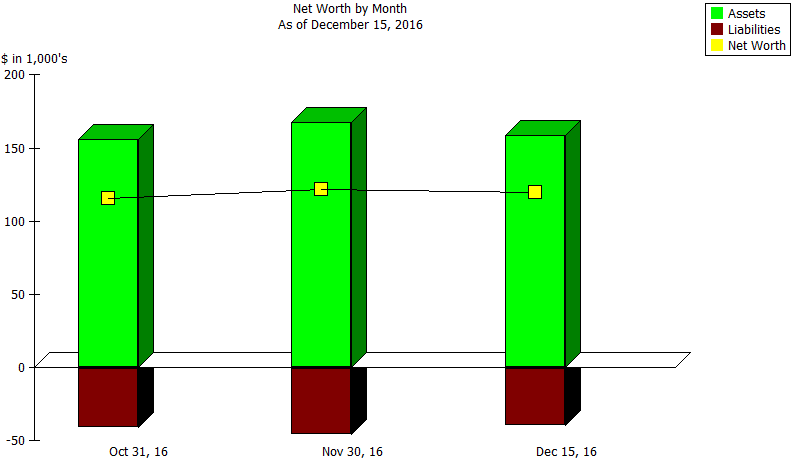
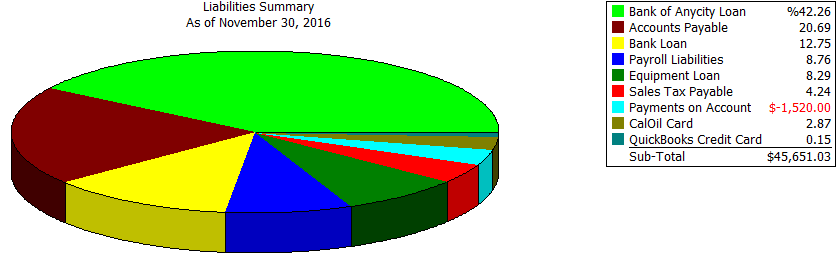
I am curious to know why November’s liabilities are greater than October’s and December’s. Double-click on an aspect of the graph to get an account breakdown. The pie chart below displays the liabilities for November and their % breakdown