QuickBooks includes a number of sales reports that can help you strategize your sales tactics and increase revenue.
The Sales by Customer Summary report shows the total sales made to each Customer and each Job. It does not include revenue from reimbursed expenses or sales tax. If you adapted QuickBooks for property management, it will show income by Tenant, Property, and Property Owner.
The Sales by Customer Detail report show what the summary report shows. In addition, it lists each transaction for each Customer and Job.
The Sales by Item Summary report displays the quantity sold of each item, the amount earned from the sale, what % of total sales that item represents, average price, cost of goods sold, average cost of goods sold, gross margin, and gross margin %. This report provides excellent information about which products and services make up your income.
The Sales by Item Detail report show each item and lists each transaction for the items.
If you track sales by employee, the Sales by Rep Summary report displays the total sales by each employee. The Sales by Rep Detail report displays each transaction for each employee.
The Sales by Ship To Address report lists all invoices, credit memos, and sales receipt by town. You can analyze where you are doing the most business.
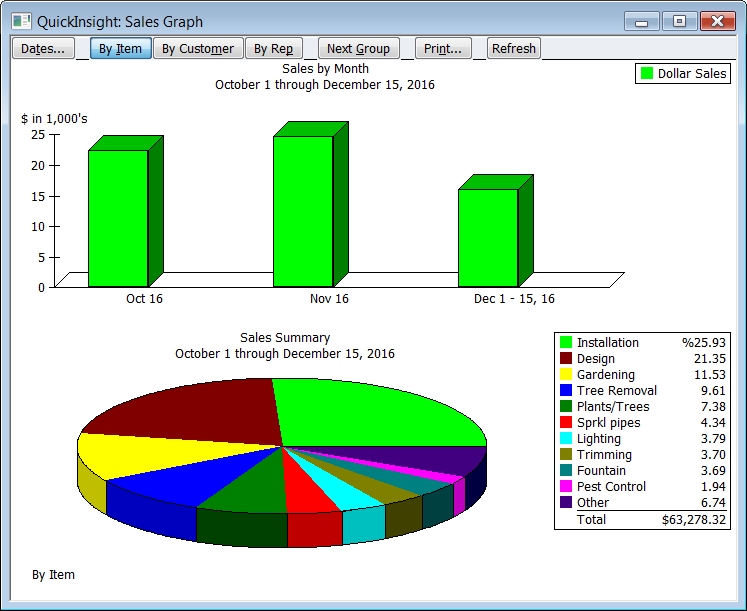
The bar graph on the Sales Graph shows the sales income for each month. The pie chart below shows the sales breakdown by item, customer, or sales rep. Click the buttons on the top to switch the pie chart.

